Understanding SNAP Recipients in New York City
About
A public-interest data story examining how Supplemental Nutrition Assistance Program (SNAP) enrollment is distributed across New York City’s 59 community districts.
This project analyzes how participation intersects with geography, population size, and physical access to SNAP centers.
Context
Growing up in a low-income household shaped my interest in public assistance systems. I wanted to understand how SNAP functions at the community level and whether the infrastructure aligns with the needs. By working at the community-district level, the project reveals disparities that borough-wide summaries often obscure.
Process
I sourced enrollment data, SNAP center directories, and 2020 Census population figures from NYC Open Data and NYC.gov.
After cleaning and standardizing the datasets across agencies, I aligned community district codes and built calculated fields for:
Percentage of residents enrolled
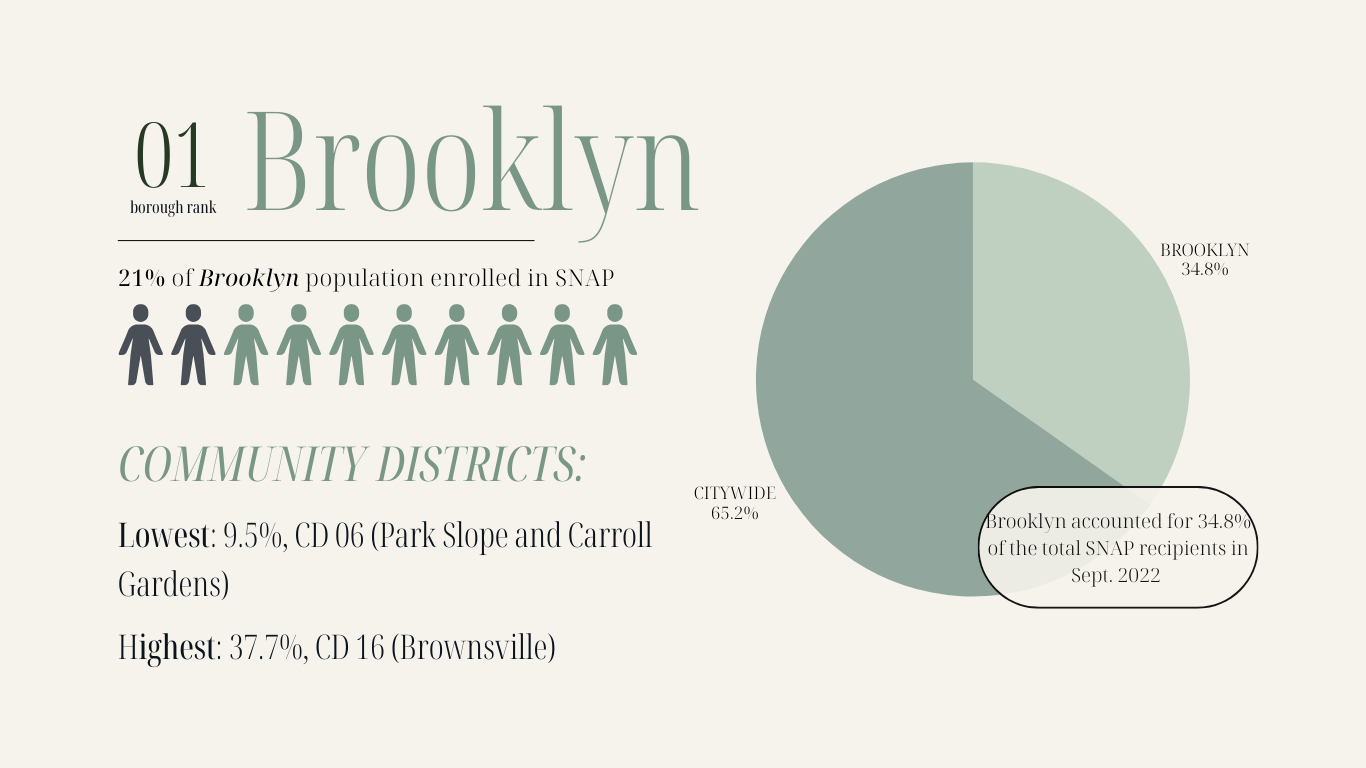
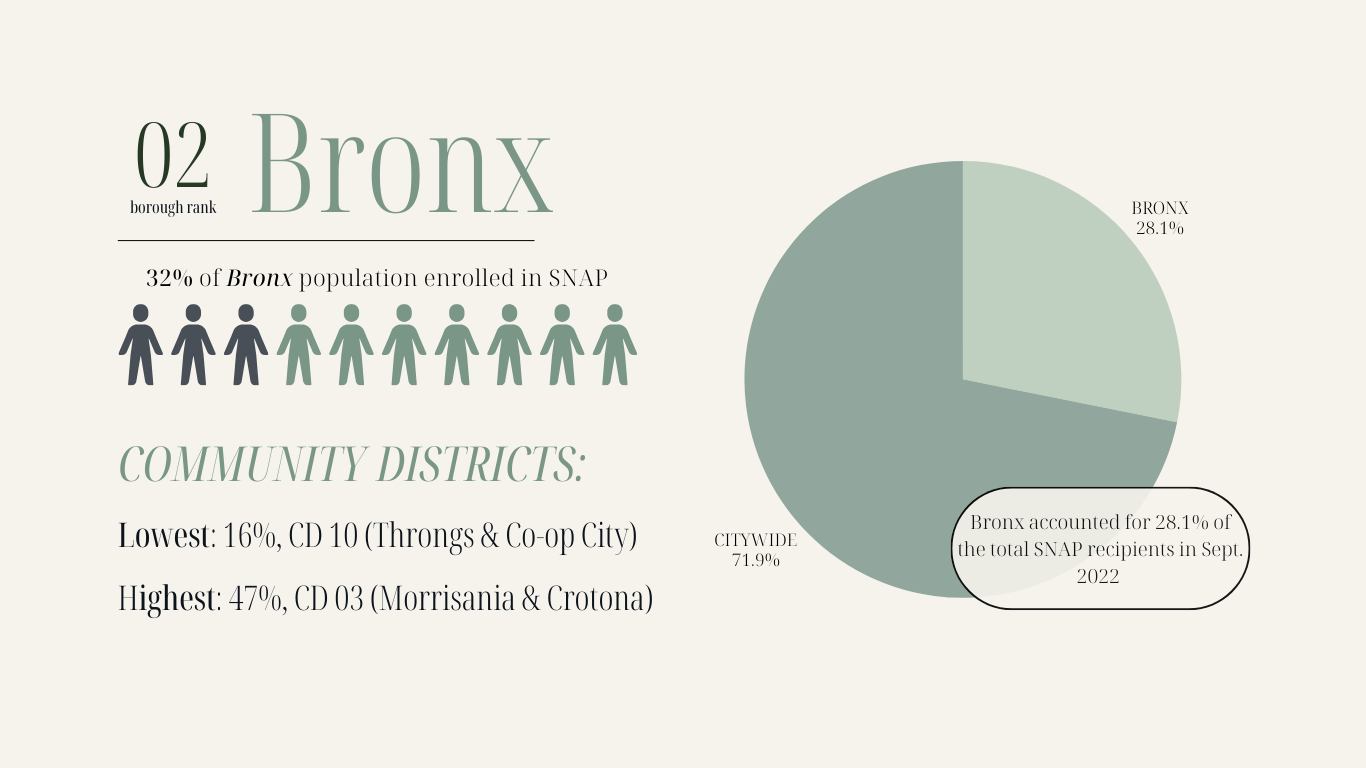
Borough-wide comparisons
Recipient-to-center ratios
Year-over-year percent change
I structured the analysis in three parts:
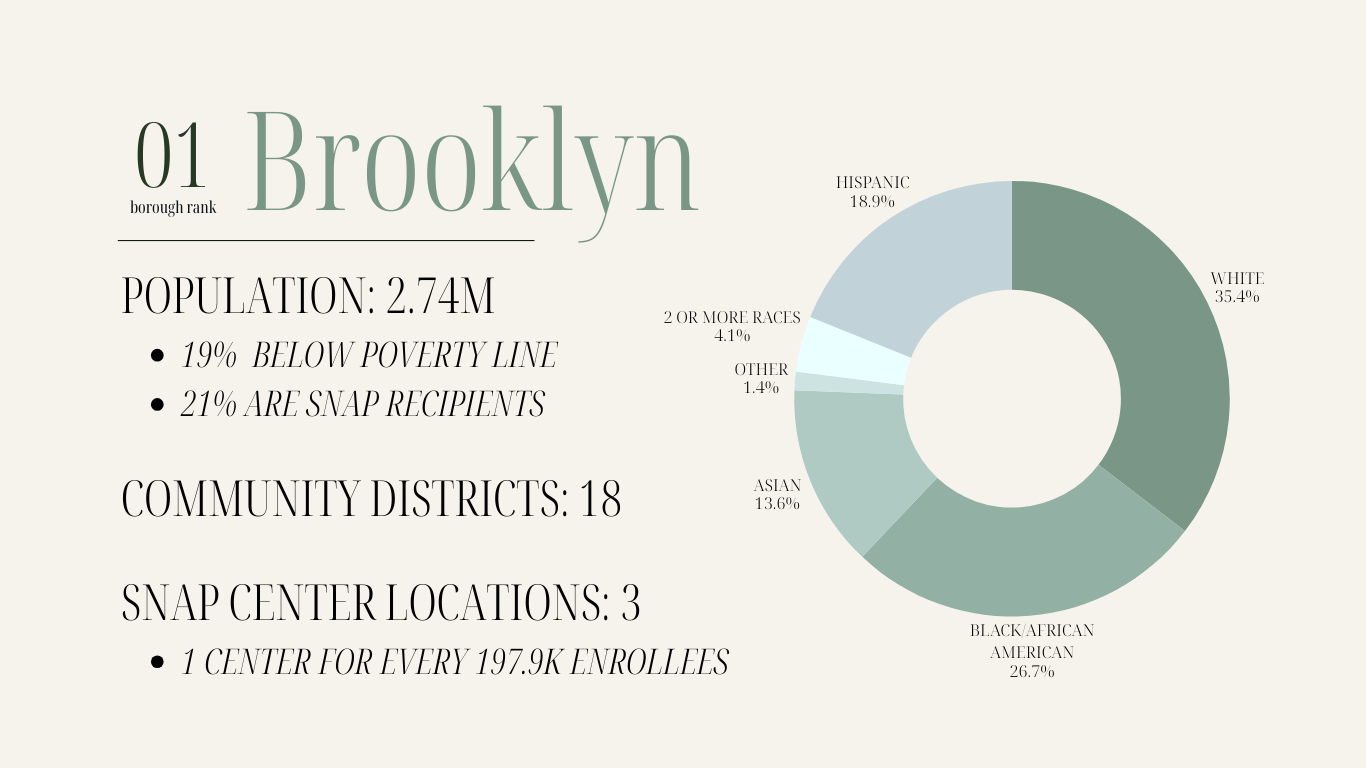
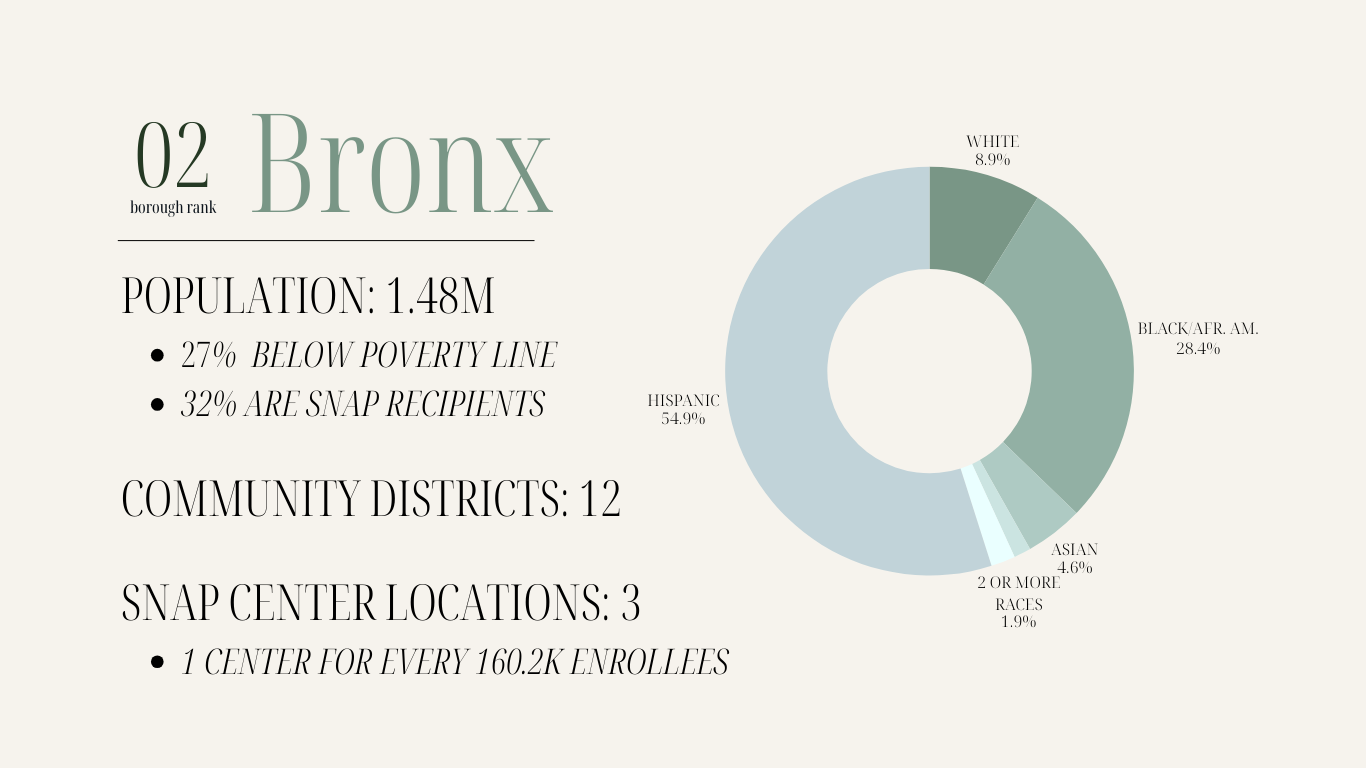
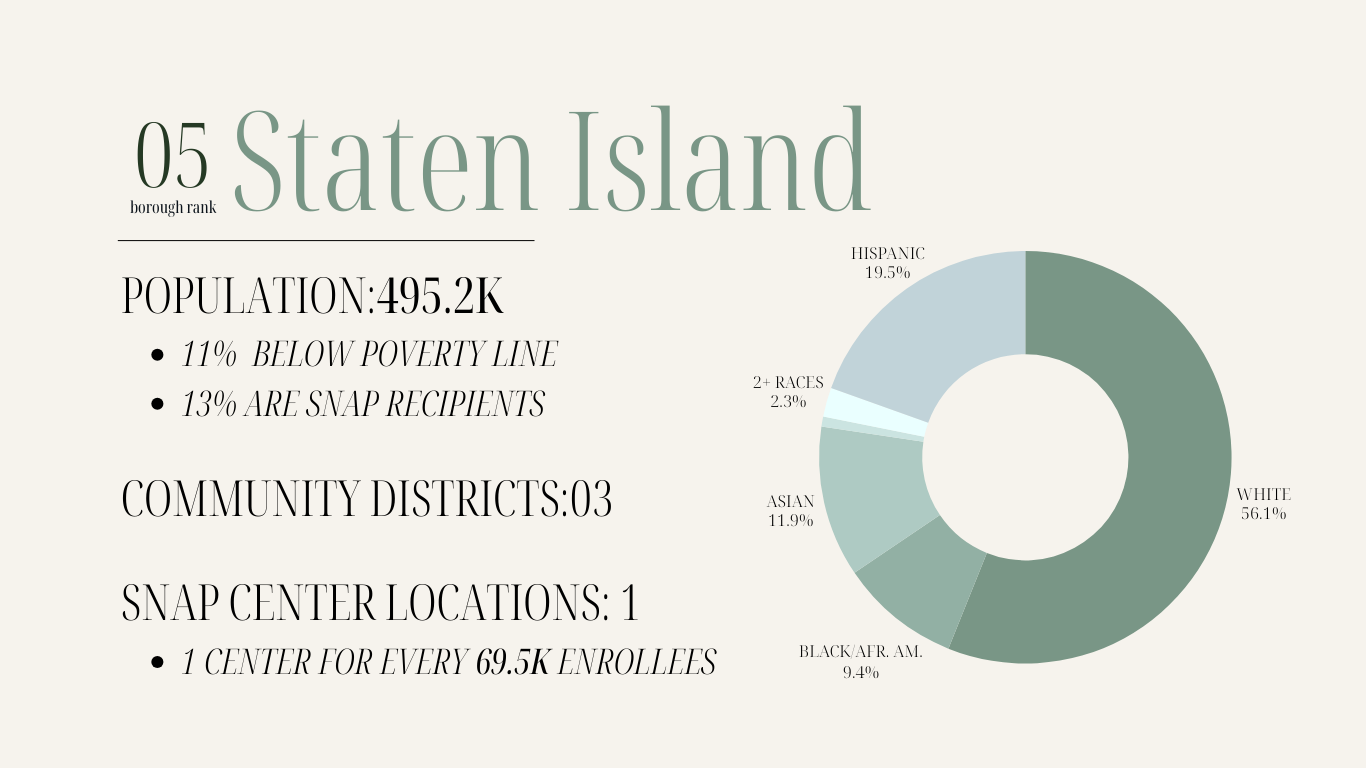
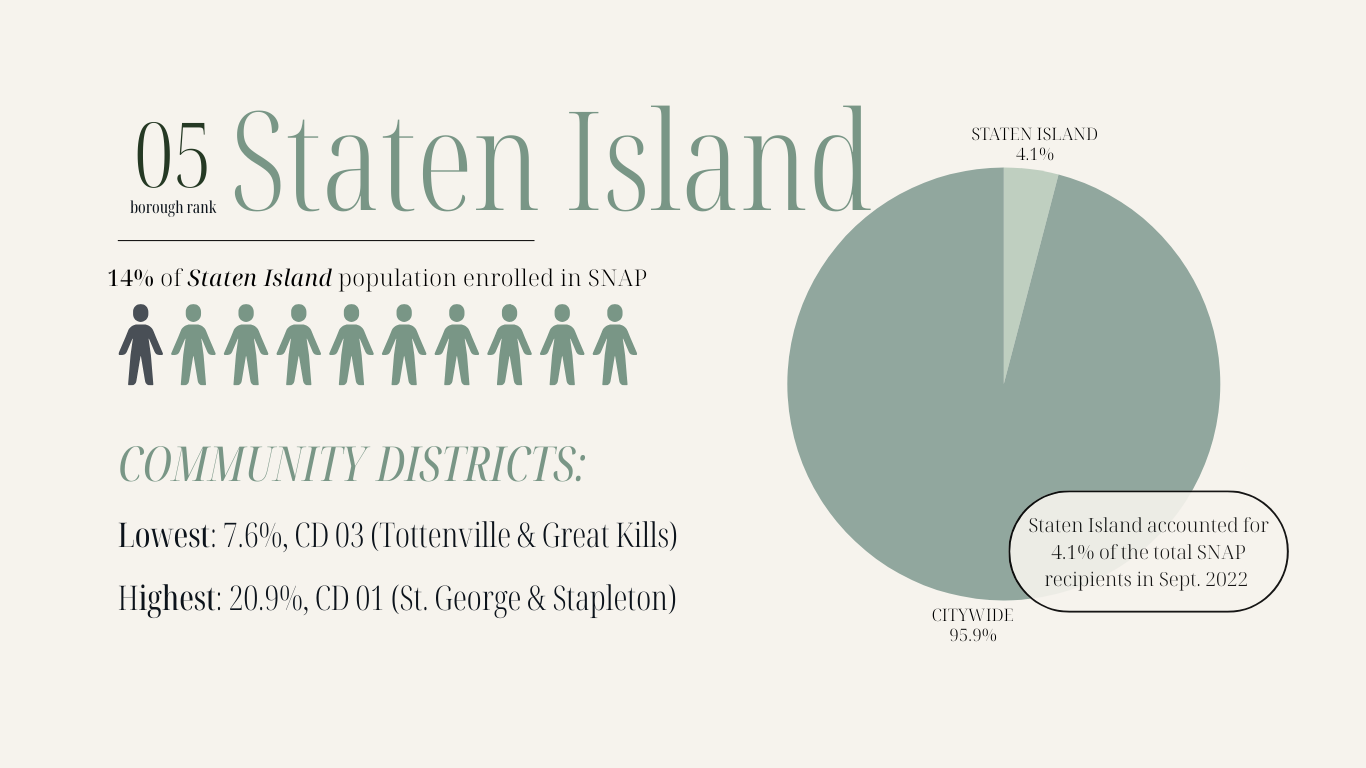
Geographic analysis — Built an interactive choropleth map of all 59 districts, with tooltips displaying total recipients, district population, enrollment percentage, and change over time.
Access analysis — Mapped the 14 SNAP centers citywide and calculated how many enrollees each location effectively serves by borough.
Trend analysis — Examined monthly enrollment data from 2018–2022 to identify shifts during COVID-19 and inflation.
I prioritized clarity in the visual design, separating complex metrics into layered visuals rather than overloading a single chart.
Outcome
Produced as a data-driven reporting project for "Big Data: Consumer Research" at The New School. The project demonstrates my ability to clean civic datasets, build relational metrics, and design interactive data storytelling grounded in public infrastructure.
-
Data Wrapper
Adobe Illustrator
Google Sheets/Excel
Canva
-
Data Portal: NYC Open Data
○ Borough/Community District Report - SNAP Population | NYC Open Data
○ Directory of SNAP Centers | NYC Open Data
Data Portal: NYC.gov
○ District Resource Statement – includes 2020 Census Data and Oct. 2021 NYC HRA Program data
○ New York City Community Health Profiles
-